Prevent & Protect the Health of Your City
In order to make our cities healthier, we must first know our “big picture” starting point. Knowing where the state is starting from and looking at current statistics assists in several ways: It provides a measuring point for the future. They may assist you when folks ask you “Why prioritize health?” And do you think you’ll look for funding? Then you’ll definitely need some statistics!
Arkansas Obesity Rates
Arkansas is experiencing an epidemic of preventable weight-related illness including obesity, type II diabetes, hypertension, stroke, and heart disease.
Our state has the sixth highest adult obesity rate in the nation. We have moved up in the rankings, but only due to other states moving down. Our rate of obesity has not changed in the last several years, but still remains high.
Arkansas Adult Obesity Rates
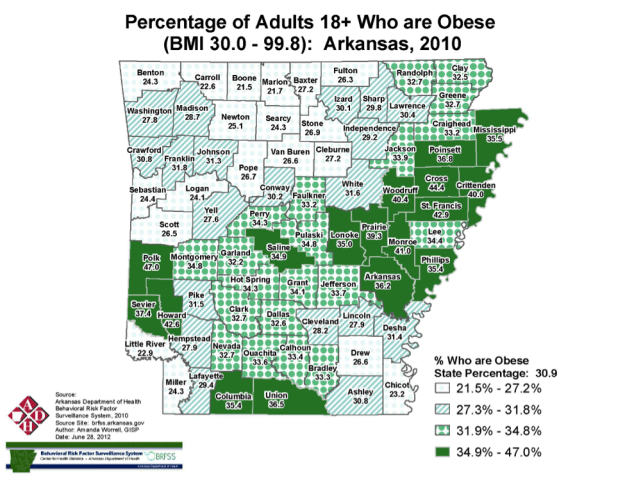
The 2016 State of Obesity Annual Report states Arkansas’s adult obesity rate is 34.5 percent, up from 25.2 percent in 2003 and from 17.0 percent in 1995.

Arkansas Adult Obesity Rates. Source: Arkansas Department of Health Behavioral Risk Factor Surveillance System, 2010
For the first time in modern history, today’s youth may not live as long as their parents.
Arkansas Childhood Obesity Rates
The current rate of obesity for Arkansas children 2 to 4 years of age in low-income families is 14.2%. (1)
20% of Arkansans 10-to-17 years old are obese. (2).
According to the 2015 Youth Risk Behavior Surveillance System, 18% of Arkansas' high school student are obese. This ranks them the fourth most obese high school students in the nation. (3)
The Price of Obesity
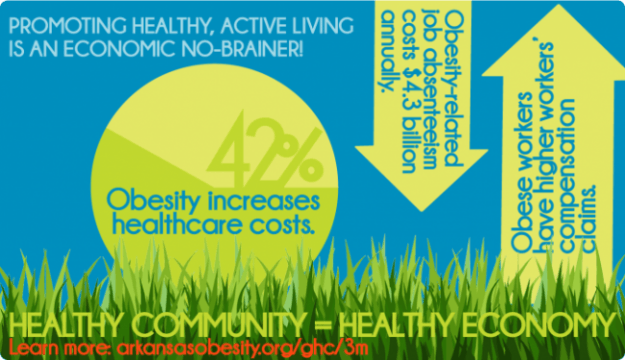
Promoting healthy, active living is an economic no-brainer!
Obesity-related medical treatment costs between $147 and $210 billion a year, or nearly 10% of all annual medical spending (based on 2006 data). The majority of the spending is generated from treating obesity-related diseases such as diabetes. (4)
Of the $147 billion, Medicare and Medicaid are responsible for $61.8 billion. Medicare and Medicaid spending would be 8.5% and 11.8% lower, respectively, in the absence of obesity. (5)
Obese people spend 42% more on healthcare costs than healthy weight people. (4)
Childhood obesity alone is responsible for $14.1 billion in direct healthcare costs. (6)
Annually, the average total health expenses for a child treated for obesity under Medicaid is $6,730, while the average health cost for all children covered by Medicaid is $2,446. The average total health expenses for a child treated for obesity under private insurance is $3,743, while the average health cost for all children covered by private insurance is $1,108. (7)
Hospitalizations of children and youths with a diagnosis of obesity nearly doubled between 1999 and 2005, while total costs for children and youths with obesity-related hospitalizations increased from $125.9 million in 2001 to $237.6 million in 2005, measured in 2005 dollars. (8)
Decreased Worker Productivity & Increased Absenteeism
Obesity-related job absenteeism costs $4.3 billion annually. (9)
Obesity is associated with lower productivity while at work (presenteeism), which costs employers $506 per obese worker per year. (10)
As a person’s BMI increases, so do the number of sick days, medical claims, and healthcare costs associated with that person. (11)
Normal weight employees cost on average $3,830 per year in covered medical, sick day, short-term disability, and workers' compensation claims combined; morbidly obese employees cost more than twice that amount, or $8,067, in 2011 dollars. (12)
Higher Workers' Compensation Claims
A number of studies have shown obese workers have higher workers’ compensation claims. (13,14,15,16,17,18)
Obese employees had $51,091 in medical claims costs per 100 full-time employees, while costs for medical claims for healthy-weight workers was $7,503. And obese workers had $59,178 in indemnity claims costs per 100 full-time employees; healthy-weight indemnity claims cost $5,396. (19)
Health & Emergency Safety Costs
Emergency responders and healthcare providers face unique challenges in transporting and treating the heaviest patients. According to one study, the number of severely obese (BMI ≥ 40) patients quadrupled between 1986 and 2000 from 1/200 to 1/50. The number of super-obese (BMI ≥ 50) patients grew by a factor of five, from 1/2,000 to 1/400. (19)
A typical ambulance outfitted with equipment and two emergency medical technicians (EMTs) that can transport a 400-pound patient costs $70,000. A specially outfitted bariatric ambulance that can transport patients weighing up to 1,000 pounds costs $110,000. (20)
A standard hospital bed can hold 500 pounds and costs $1,000. A bariatric hospital bed that can hold up to 1,000 pounds costs $4,000. (20)
Costs for patients presenting at emergency rooms with chest pains are 41 percent higher for severely obese patients, 28 percent higher for obese patients, and 22 percent higher for overweight patients than for healthy-weight patients. (21)
Making a Smart Start
There’s no need to reinvent the wheel! Arkansas leaders (many of whom are ArCOP members and/or heads of partner organizations) have put their brainpower together and have launched a ten year plan to combat obesity. Read on to see what YOU can do to help protect your city!
Combating Arkansas Obesity
In 2013, state leaders met at the Winthrop Rockefeller Institute to begin the creation of a 10-year plan for combating obesity in the state. The plan was developed via a series of facilitated discussions among leaders in the field who were selected by the conference advisory, steering and scientific committees (full list in appendix C). This report provides a framework of research-based strategies to guide community efforts to reduce obesity- a major factor in improving health. These are accompanied by recommendations for efforts that must be orchestrated on the state level.
The priority areas are modeled after the Institute of Medicine (IOM) goals outlined in their 2012 report Accelerating Progress in Obesity Prevention: Solving the Weight of the Nation. The discussions during the conference and at two subsequent meetings focused on refining the priority areas and on developing strategies and action steps to be completed within a reasonable time frame. Each priority area outlines two-, five-, and 10-year goals to facilitate achievable successes in obtaining a healthier Arkansas. The Healthy Active Arkansas plan is meant to be used by a wide range of stakeholders, including businesses, education centers, religious organizations, restaurants, city planners, and more.
In order for the state's priorities to be realized, Arkansas will need a new organization to provide infrastructure, authority, and ownership. This entity will be responsible for planning, implementing, oversight, and ongoing leadership. Funding for this organization will need to be secured from private and public sources.
The nine priority areas this framework is built around are as follows:
Physical and Built Environment: Encourage all stakeholders to create livable places that improve mobility, availability, and access within the community where they live, work, and play.
Nutritional Standards Government, Institutions, and the Private Sector: Ensure uniform access to healthy foods and beverages to consumers in government, institutional, and private sector settings.
Nutritional Standards in Schools—Early Childcare Through College: State and local governments, early childcare providers, school districts, and colleges will provide food and beverages that align with the Dietary Guidelines for Americans and promote health and learning.
Physical Education and Activity in Schools—Early Childcare Through College: State and local governments, early childcare providers, school district, and colleges ensure that all students have opportunities for daily physical activity and quality physical education that promotes healthy lifestyles.
Healthy Worksites: Worksites will establish healthy environments that promote good health through prevention, reduce healthcare costs associated with chronic illness and disability, and improve employee productivity.
Access to Healthy Foods: State and local governments and other stakeholders will promote education, public policies, and access to affordable healthy foods for all Arkansans.
Sugar-Sweetened Beverage Reduction: Decision-makers in the business community/private sector, nongovernmental organizations, educational institutions, and at all levels of government will adopt comprehensive strategies to reduce over-consumption of sugar-sweetened beverages in worksites, public places, recreational facilities, and schools.
Breastfeeding: Women, health service providers, employers, communities, and other key stakeholders will adopt, implement and monitor policies that support and increase the proportion of mothers who initiate and continue optimal breastfeeding practices.
Marketing Program: Develop and implement a robust, sustained, and culturally-appropriate targeted communications and marketing program aimed at changing norms and behaviors with respect to physical activity and nutrition.
Citations
- http://stateofobesity.org/wic/
- http://stateofobesity.org/children1017/
- http://stateofobesity.org/high-school-obesity/
- Finkelstein EA, Trogdon JG, Cohen JW, Dietz W. Annual Medical Spending Attributable to Obesity: Payer- and Service-specific Estimates. Health Affairs, 28(5): w822-831, 2009.
- https://www.cms.gov/research-statistics-data-and-systems/statistics-trends-and-reports/nationalhealthexpenddata/nhe-fact-sheet.html
- Trasande L. and Chatterjee S. The Impact of Obesity on Health Service Utilization and Costs in Childhood.Obesity, 17(9):1749-54, 2009.
- Marder W and Chang S. Childhood Obesity: Costs, Treatment Patterns, Disparities in Care, and Prevalent Medical Conditions. Thomson Medstat Research Brief, 2006 (accessed March 2010.)
- Trasande L, Liu Y, Fryer G, et al. Effects of Childhood Obesity on Hospital Care and Costs, 1999-2005. Health Affairs, 28(4): w751-60, 2009.
- Cawley J, Rizzo JA, and Haas K. Occupation-specific Absenteeism costs Associated with obesity and Morbid obesity. Journal of Occupational and Environmental Medicine, 49(12):1317-24, 2007.
- Gates D, Succop P, Brehm B, et al. Obesity and Presenteeism: The Impact of Body Mass Index on Workplace Productivity. Journal of Occupational and Environmental Medicine, 50(1):39-45, 2008.
- Heithoff KA, Cuffel BJ, Kennedy S, Peters J. The Association Between Body Mass and Health Care Expenditures.Clinical Therapy, 19(4):811-820, 1997.
- Van Nuys K, Globe D, Ng-Mak D, et al. The association between employee obesity and employer costs: evidence from a panel of U.S. employers. Am J Health Promotion. 2014; 28(5):277-285.
- Ostbye T, Dement JM, and Krause KM. Obesity and Workers’ Compensation: Results from the Duke Health and Safety Surveillance System. Archives of Internal Medicine, 167(8): 766-73, 2007.
- Pronk NP, Martinson B, Kessler RC, et al. The Association Between Work Performance and Physical Activity, Cardiorespiratory Fitness, and Obesity.Journal of Occupational and Environmental Medicine, 46(1):19-25, 2004.
- Aldana SG and Pronk NP. Health Promotion Programs, Modifiable Health Risks, and Employee Absenteeism.Journal of Occupational and Environmental, 43(1): 36-46, 2001.
- Gordian Health Solutions. Managing the Obesity Problem: A Case Study with Measurable Results. Nashville, TN: Gordian Health Solutions, 2007.
- Wang F, McDonald T, Champagne LJ, et al. Relationship of Body Mass Index and Physical Activity to Healthcare Costs Among Employees. Journal of Occupational and Environmental Medicine, 46(5): 428-36, 2004.
- Burton WN, Chen CY, Schultz AB, et al. The Economic Costs Associated with Body Mass Index in a Workplace. Journal of Occupational and Environmental Medicine, 40(9): 786-92, 1998.
- Berger E. Emergency departments shoulder challenges of providing care, preserving dignity for the ‘super obese.’Annals of Emergency Medicine, 50(4): 443-45, 2007.
- Zezima K. “Increasing Obesity Requires New Ambulance Equipment.” The New York Times. April 8, 2008.
- Peitz GW. Association of body mass index with increased cost of care and length of stay for emergency department patients with chest pain and dyspnea. Circ Cardiova Qual Outcomes. 2014;7(2):292-298.


